Designcaser
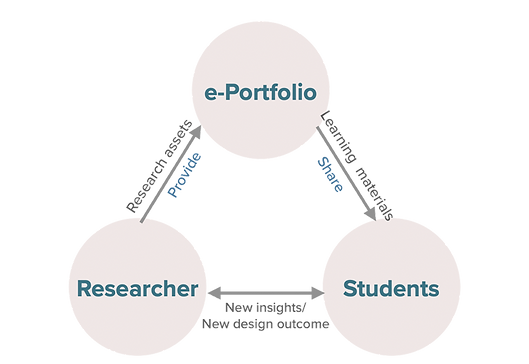
DesignCaser is a eLearning tool for sharing secondary data collected from past design case studies. Our goal is to make past resources available for HCI students and enable them to learn from them.
Methods
Interview & Observation & Survey
Thematic Analysis
Participatory Design
Persona/Storyboard
Heuristic Evaluation
Cooperative Evaluation
Iterative Design
Tools
Maxqda; Excel
Miro
Sketch/Invision
Data Analysis:
Brainstorm:
Prototype:
Duration
Seminars: 2018-2020
Problem framing: 2018
PD and Development: 2019
Appropriation: 2020
Redesigned: 2021
My Role
User Research
Interaction design(Partly)
Manage design tasks
Design Context
The Challenges
While research data is sealed in digital repositories when design projects come to an end, HCI students often learn and practice design with limited given contexts in learning environments. Teachers are failed in providing the complexity and contextualization of real design contexts.
For the first time, past design project documentation has been shared with students in design seminars and fostered students to access the under-explored design cases to learn design.
-
Data sensitivity(e.g. healthy data)
-
Data quantity and variety
-
Interdisciplinary users
-
Unfamiliarity with empirical data
After Seminars:
The third version of DesignCaser
Tutorial for new user

Re-Design
Implications
Take the advantage of the power of metadata
Explore new forms of contextual information
Provide comfort communication channel between data-user and creator
Support interdisciplinarity
Redesign for timebar
New user assistance
01
What is it about?
A tutorial assistance new users

02
What do we have?
Support interdisciplinary users in searching
Support interdisciplinary searching by pre-defined themes/tags

Data is more than "data"
Searching result are mixed, and filterable

03
What is this design case about?
Demonstrate design projects in one-glance


contextual project activities in timeline
Breif Project introduction
Recommendation from data creator
Method is key for exploring design projects
Sections that structured based on Methods

04
Eisberg data structure:
from shallow to deep
How to explore data?
top to down and shallow to deep

05


1st level of meta-data
Mouse over
Meta-data & tags help users in making sense of data in a short-term
Click and show 2nd level of metadata

what is this file about?
06

Research interests generated from associated data

Click and show related information
Network of data and people

07
Support data curation and data sharing
Uploading support for data provider(design researchers)


Local and cloud repository support
Guided steps and frameworks

uploading page preview

Flexible access rights
Predefined Metadata categories
create linkage among files
Suggest tags that extracted from data

DESIGN QUESTION
How do we create valuable, accessible and sustainable learning resources for students?
Discover problems in re-using design cases
Seminar 01


Analysis past data
Key Findings
Past design cases are valuable for students to learn User-Centred Design.
Interdisciplinary students explore shared material in various ways
Secondary qualitative data is a mystery
Needs of contextual information
Overview and Method are key
User Needs
Improve data exploring experience
Show project in one-glance
Identify and provide needed contextual information
Design Ideas
Improve the data visualisation
Design data Curation process
Meta-Data function
Support interdisciplinarity
Seminar 02/03
Co-Design & Development
Emerge ideas & Development


Data volume represented by reading time after the discussion with designer from last seminar
Redesigned Bubble Method
Co-Design with the end-user group
Design Group A
Interdisciplinary backgrounded Views

Well-presented design case overview

Explore data from top to down(eisberg metaphor)

Design Group B
Systematic curation

Visualized qualitative data (Bubble view)

Required Meta-data (e.g. interview)

Test with the end-user group
Seminar 04
Key Findings
Data has been well perceived in the exploration process
Meta-data was effective
Interdisciplinary Views are confusing(8 out of 14)
Time-bar is confusing(10 out of 14)
Re-design Reqiurements
Take the advantage of the power of metadata
Explore new forms of contextual information
Provide comfort communication channel between data-user and creator
Support interdisciplinarity
Redesign for timebar
Students avoid communication with the creator
Assistance for new users
Unisibity problems(eg.lack of support system)
Why we share past design case studies?
Past Design Cases sealed in their Repositories.
Design researchers estimated that only "one third of data has been published and used"
--Design researcher from research project
Students lacking real design experience and resources with real users.
"…we sent more than 20 emails (last month) to those companies (for investigating our group design topics), but so far, we haven’t got any reply. "
-- HCI Student
Lacking resources of learning how seniors solve design problems
"I choose data from 're-design' stage, because I want to see how a prototype was planned and tested in the real world"
-- HCI Student
Design Outcomes
Easy to identify the data users need(13 out of 14).
Students found the shared data well organised and do not need extra help in the exploring process in the fourth seminar.
Able to access real design problems and understand users more efficiently
(14 out of 14)
They learned how to make sense of and analyze data collected by others, and stress design wicked problems from real design context.
Learn user-centred methods by practising it(14 out of 14)
Promoted User-Centred Method learning by practicing with real data.
"I finally know whom I am designing for and where my design ideas come from."

Empirical collection
34
Students
16
Formal Interviews
39
Video Records
&
Observation Notes
93
Submitted Reports
Take Away
Design field is constantly evloving and design method needs to adapt to new changes.
Ethical issue is key in the data pratice field, designer needs to take extra care of stakeholders' individual benefits and concerns.
And secondary data can be a valueable resource for students, but it can never substitute ethnographic pratices in real field. Designer should always bury it in mind while designing.
Moreover, test result can be differed from the real-use scenariou, UX designers should try to understand ‘real’ design problems in the real use scenarios.
At last but not least, there are more formats of data did not been explored and tested in self-learning enviornment, our design case study is just a start of exploring secondary data in this field.


